

A couple is sitting at a kitchen table with 12 finish swatches fanned out between them. The pergola they want covers a patio that has been bare for three summers. The first swatch is anthracite. The second is anthracite, but warmer. The third is a graphite that looks anthracite in low light. Neither has committed to a colour or a size. Both want this pergola, badly. They go to bed. The decision goes with them.
The stall is not a lack of information. It is too much of it, in the wrong shape, and nothing on the table looks like the pergola in their head.
We used to lose winter to indecision. The buyers liked the product, they just could not picture it on their terrace before March. The day we put the configured 3D in front of them, we closed 14 deals in a quarter that used to give us 6.
Indecision is the single largest leak in custom project sales, and the most misdiagnosed.
Why indecision in custom projects is a structural problem#
Custom categories ask the buyer to hold an unreasonable load in their head. A 5 by 4 metre louvered pergola in three finishes, four motor options, two louvre styles, and five accessory sets is around 240 valid combinations. Human working memory holds about 4 chunks at a time, the Cowan 4-chunk limit. A 240-combination decision is 60 times that capacity.
Nobody can carry that load. So the buyer compresses: drops the accessory tier, fixes on one finish family, and stalls on the variables that survive because they cannot tell them apart without seeing them.
The brochure does not help; it shows 14 pergolas in 14 settings owned by 14 other people. The contact form does not help; it asks the buyer to commit to a conversation before they have committed to a spec. Custom projects are not retail purchases. The buyer cannot pick the product up and decide if it feels right, so keeping the decision open is cheaper than committing to a purchase they cannot yet see.
The 3 visual moves that break the deadlock#
Three behaviours, in order. Each reduces the buyer’s load by a different mechanism. Skip one and the stall returns.
Move 1: show the spec in the buyer’s context. The buyer is deciding on a pergola against their own patio, brick colour, and window frames, not a generic model on a grey backdrop. A render on a stock lawn still makes them mentally transplant the image onto their property. A render placed in their own context removes that step. The buyer reacts instead of imagining, and the reaction is the decision moment.
Move 2: narrow by elimination, not by addition. Most sellers respond to indecision by adding choices, which raises the load instead of lowering it. The opposite move is the anti-option: tell the buyer plainly what does not fit them. A configurator that rules options out is doing the editing work the indecisive buyer cannot do for themselves.

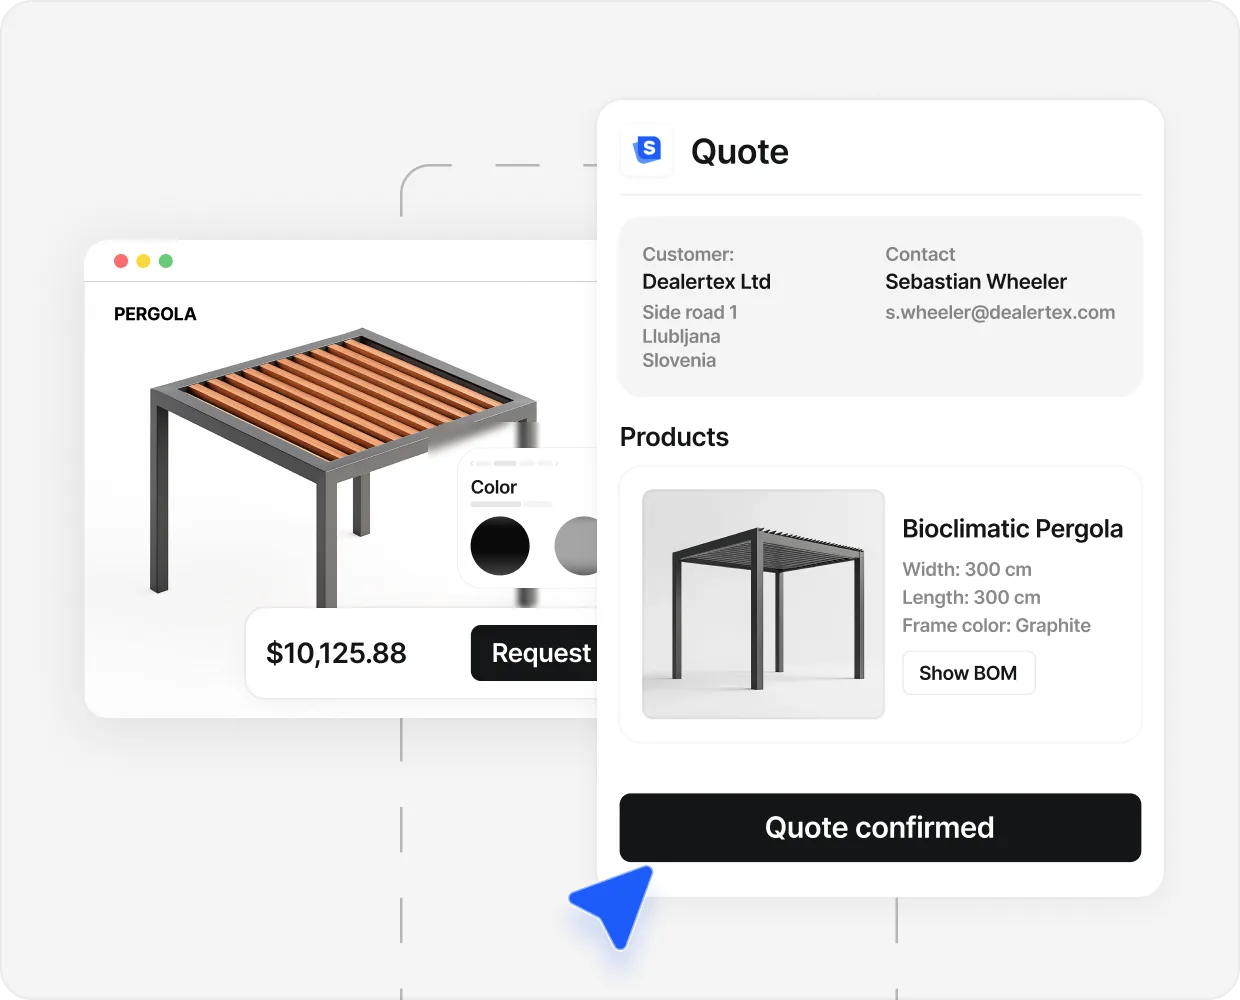
Move 3: show the price as the picture changes. Part of the stall is the unknown number behind the brochure. A real-time price band, updating as the buyer swaps the roof type or adds a motor, fills the gap. The buyer is no longer deciding between two pictures and a mystery number; they are deciding between two priced pictures. They either pick or walk, and both beat waiting for a faster competitor’s priced PDF.
The order matters: context first, elimination second, price third. Reverse it and the flow stalls in the same place every time.
Where visualization fails#
Most teams who ship a visualization layer do not see the close-rate lift, because the visualizer was treated as a marketing surface, not a decision-reduction tool.
The gallery, not the configurator. A viewer that only rotates four pre-built pergolas in stock scenes is the brochure problem, rendered. The difference between a pergola visualizer and a configurator is whether the buyer leaves with a price.
The no-price flow. The spec resolves but the price hides behind a contact form. An indecisive buyer will not commit to a form on a spec they are still half-deciding. Show the price band from question one.
The everything-or-nothing menu. Forty finishes and eighteen motor options with no recommended path just moves the indecision to the option screen. Default the 80 percent of buyers who want the standard spec to the standard spec, and let the rest go one click deeper.
What the data shows about close rate after visualization#
Caribbean Blinds, a UK pergola seller, generates 508 leads in 90 days with 40 percent of inquiries arriving as configured 3D quotes. Those buyers walked into the configurator with the same stall every custom-project buyer carries, and walked out with a designed spec they had decided on themselves.
Spa Solutions, a Swiss pergola business, doubled the winter close rate to 17 percent in the quarter after the configurator went live: 87 leads, 14 deals, €214K of revenue in a season that used to give them roughly 6 deals. Winter is the cleanest test of indecision: the buyer cannot stand on the deck and feel the sun, so the configured render does the picturing the season denies them.
The industry data lines up. Shopify and Cylindo research on AR and 3D configurators shows an 88 percent average-order-value uplift on configured products. Buyers who can see the spec close on a higher-spec build, because the picture sells the upgrade.
- 508 leads in 90 days Caribbean Blinds (UK, pergolas); 40 percent arrive as configured 3D quotes after the visual flow went live.
- 17% winter close rate Spa Solutions (Switzerland, pergolas); 87 leads, 14 deals, €214K in a quarter that used to give them 6 deals.
- 88% AOV uplift on 3D configured products Shopify and Cylindo industry data across furniture and outdoor living categories.
- 240 valid combinations in a typical custom pergola spec Why the brochure-and-callback loop stalls, and why the 3D render is the decision-reduction tool the spec sheet was supposed to be.
The named numbers; the full stories live in the case studies.
The volume of leads is not the headline. The compression of the decision is. Buyers who used to stall for two weeks at the swatch stage now arrive at the sales call with a designed PDF in hand, having decided.
The kitchen table is still the kitchen table. What changes is whether the picture in the buyer’s head is theirs, or somebody else’s catalogue. Without the render, the brochures stay on the table and the decision goes to bed unsolved. With it, the buyer points at the screen and says “this one.”
If you want to see the full pattern, the case studies hold the named numbers next to the named customers. If you are mapping the technology question first, the difference between a 3D product configurator and a basic visualizer is worth drawing before any of the moves above are scoped.
People also ask.
Why are buyers indecisive in custom product categories?
Custom categories ask the buyer to hold too many combinations in their head at once. A 5 by 4 metre louvered pergola in three finishes, four motor options, two louvre styles, and five accessory sets is around 240 valid combinations. The stall is not a lack of information. It is the buyer protecting themselves from a five-figure purchase they cannot yet see.
Does more information help an indecisive buyer?
Almost never. More brochures and swatches add to the load the buyer is already failing to carry. The fix is the opposite: collapse the combinations into 1 concrete picture, then change one variable at a time.
What is the anti-option move?
Most sellers try to break indecision by adding choices. The anti-option move does the opposite. It tells the buyer, plainly, what does not fit them. Removing the wrong options is faster than weighing all of them, and buyers report the rejection moment as the moment they trusted the seller.
Does seeing a price help or hurt the decision?
It almost always helps, even when it stings. An indecisive buyer is partly stalling on the unknown number behind the brochure. The buyer either says yes and proceeds, or says no and self-filters out. Both beat the third option, where they drift and sign with a faster competitor.
When is indecision a sign the buyer is not ready?
Three signals: no fixed project date, no budget agreed with the household, and no co-decider has engaged. If all three are true, send the configured PDF, mark the lead as nurture, and check back. Pushing closes nothing.